
Biomarker-Based Patient Selection in NSCLC Clinical Trials: EGFR, ALK & PD-L1 (2026)
Linda
How molecular testing shapes oncology trial eligibility, treatment evidence, recruitment trade-offs, and the interpretation of clinical outcomes.
Biomarkers have become central to precision oncology. Instead of enrolling everyone with a diagnosis of non-small cell lung cancer (NSCLC) into the same therapeutic study, many modern trials define a narrower population using molecular alterations or protein-expression thresholds. This changes not just who receives a treatment, but also the meaning of the evidence generated by the trial.
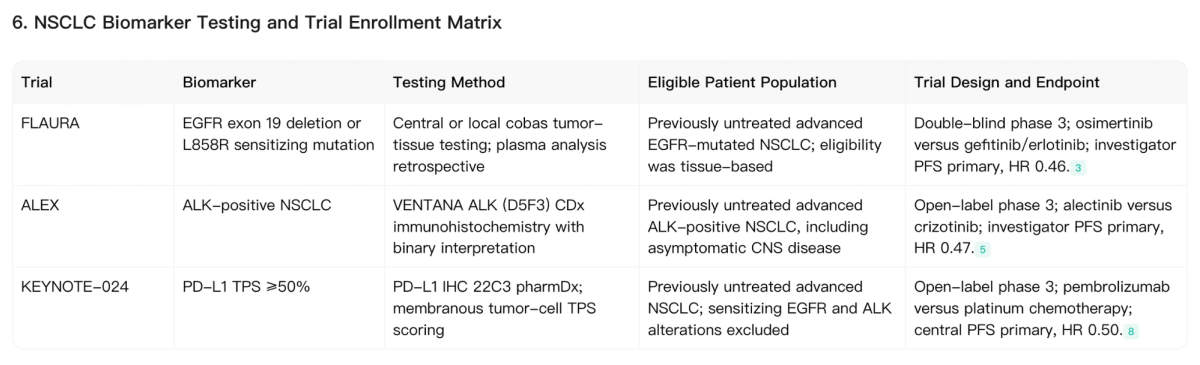
EGFR-mutated, ALK-positive, and PD-L1–high NSCLC provide three instructive examples. In the phase 3 FLAURA, ALEX, and KEYNOTE-024 studies, biomarker eligibility was specified before randomization, allowing each trial to test a treatment strategy in a biologically defined population. Yet the assays, thresholds, comparators, and clinical interpretations were different. 1 3 5
This article follows a source-grounded Noah AI literature analysis of those three studies. The aim is to show how researchers can organize published biomarker-testing evidence, enrollment rules, primary endpoints, and results in a way that is useful for clinical development review. It does not establish that Noah performs diagnostic testing or independently determines trial eligibility.
Increasing Adoption of Precision Medicine
Precision medicine aims to use information about biological differences among patients to guide the development or use of therapies. In oncology, that information can come from activating mutations, gene rearrangements, protein expression, or other measurable features of a tumor. A biomarker is valuable only in relation to a clearly defined clinical question: which patient, which treatment, which test, and which disease setting?
Two terms are particularly important. A prognostic biomarker is associated with the course of a disease irrespective of a particular treatment. A predictive biomarker provides information about the likelihood of response or differential treatment benefit from a specified therapy. These roles should not be conflated; a molecular association with outcomes does not automatically establish that the marker predicts a drug-specific treatment effect.
The FDA describes predictive enrichment as prospectively selecting patients considered more likely to respond to an investigational treatment. Such selection may make a treatment effect easier to detect, but the resulting evidence applies primarily to the population studied. 8
Three Different Biomarker-Selection Models in NSCLC
- EGFR activating mutations: FLAURA selected common sensitizing alterations—exon 19 deletions and L858R. These are specific mutation categories, not a generic "EGFR-positive" label.
- ALK-positive tumors: ALEX defined eligibility through an ALK immunohistochemistry-based diagnostic approach. Here, the test result identifies a population for ALK-targeted inhibition.
- PD-L1 expression: KEYNOTE-024 selected tumors with PD-L1 tumor proportion score (TPS) of at least 50%, in a setting excluding sensitizing EGFR alterations and ALK translocations. PD-L1 is an imperfect, treatment-context-dependent enrichment marker—not a universal binary rule for immunotherapy.
Companion diagnostics add another layer to the evidence. Assay platform, specimen type, scoring rules, quality control, and the defined cutoff can all affect patient classification. Two tests measuring a related biological target are not automatically interchangeable. The FDA's companion diagnostics list is one starting point for checking authorized test–therapy pairings.
Informing Therapy and Clinical Trial Recruitment Decisions with Biomarkers in Oncology
To interpret a biomarker-selected trial, investigators need to move from a broad marker name to the actual enrollment rule. Was the biomarker assessed prospectively? Which tissue or blood specimen was used? What counted as positive? Were patients with other driver alterations excluded? And which primary endpoint was used to compare the randomized groups?
FLAURA: EGFR mutations define the treatment population
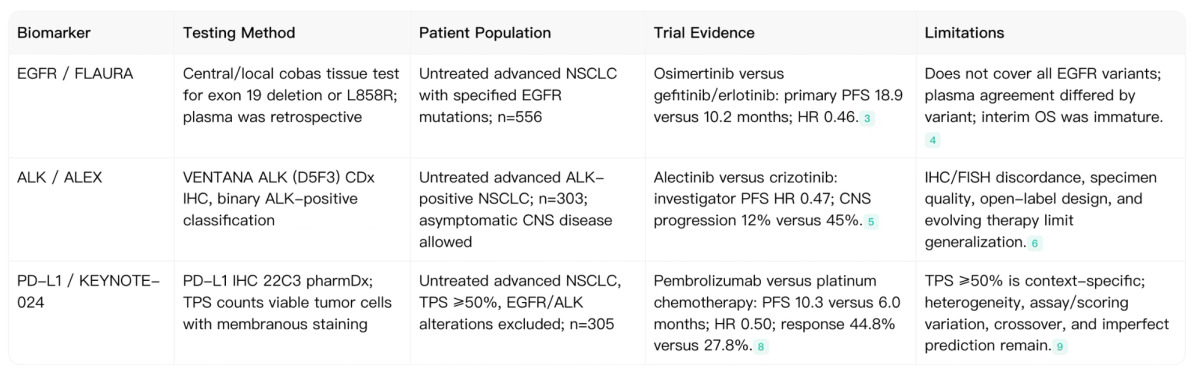
FLAURA (NCT02296125) enrolled 556 patients with previously untreated advanced NSCLC carrying an EGFR exon 19 deletion or L858R mutation. Patients were assigned to osimertinib or a comparator EGFR inhibitor—gefitinib or erlotinib. The primary endpoint was investigator-assessed progression-free survival (PFS). Median PFS was 18.9 versus 10.2 months (hazard ratio [HR] 0.46; 95% CI 0.37–0.57). 1
The testing method matters. Enrollment relied on tumor-tissue EGFR results obtained centrally or using an accepted local test. Subsequent analysis of baseline plasma circulating tumor DNA was retrospective; it was not the universal screening method used to determine eligibility. Positive percentage agreement between plasma and reference tissue testing also differed by alteration: 79% for exon 19 deletion and 68% for L858R. A negative plasma result therefore cannot simply be equated with absence of an EGFR mutation. 2
The primary FLAURA analysis demonstrated benefit in the selected common sensitizing-mutation population. It did not show that every rare EGFR variant has the same drug sensitivity or that tissue and plasma assays can be substituted without validation. Its original overall-survival assessment was immature at that time; later survival evidence belongs to a different analysis and data cutoff.
ALEX: ALK identification and CNS outcomes
ALEX (NCT02075840) randomized 303 patients with previously untreated advanced ALK-positive NSCLC to alectinib or crizotinib. ALK positivity was assessed with the VENTANA ALK (D5F3) CDx immunohistochemistry assay. The trial's primary endpoint was investigator-assessed PFS; the HR for progression or death was 0.47 (95% CI 0.34–0.65). The 12-month PFS estimate was 68.4% with alectinib and 48.7% with crizotinib. 3 4
ALEX also evaluated CNS progression, an important outcome in ALK-positive lung cancer. CNS progression occurred in 12% of the alectinib group and 45% of the crizotinib group in the reported primary analysis. These results are meaningful within the enrolled population and protocol, but they do not establish performance for every ALK testing platform or all patients with intracranial disease. 3
KEYNOTE-024: PD-L1 expression is a contextual selection threshold
KEYNOTE-024 (NCT02142738) randomized 305 patients with previously untreated advanced NSCLC and tumor PD-L1 TPS of at least 50%. Eligibility excluded sensitizing EGFR alterations and ALK translocations. The biomarker was assessed using the PD-L1 IHC 22C3 pharmDx assay. Pembrolizumab monotherapy was compared with platinum-based chemotherapy. 5 6
Median PFS was 10.3 versus 6.0 months (HR 0.50; 95% CI 0.37–0.68). Objective response was reported in 44.8% versus 27.8% of patients. The result supports pembrolizumab in the defined study population, not the proposition that every PD-L1–high tumor responds, or that patients with lower TPS necessarily cannot benefit from other immunotherapy regimens. 5
Noah AI evidence example: from assay to enrollment rule
The first Noah analysis table places the three studies side by side, preserving the biomarker definition, testing method, selected population, randomized treatment comparison, and primary endpoint. It helps reveal why "EGFR," "ALK," and "PD-L1" are not sufficient descriptions of clinical trial eligibility on their own.
Shortening Clinical Trial Timelines
Biomarker-directed enrollment can improve clinical development efficiency when it identifies patients more likely to benefit. Selecting a biologically responsive subgroup may reduce heterogeneity and increase the observed effect size, which in some circumstances can reduce the sample size needed to test a hypothesis. FDA guidance recognizes these potential advantages while emphasizing study-design and generalizability considerations. 8
However, biomarker enrichment creates operational costs. A rare alteration may be found in only a small fraction of screened patients. Tissue may be inadequate, an assay may need repeating, a specialist center may be required, and the selected population may not reflect the broader disease population. Faster or smaller trials are therefore possible outcomes, not guaranteed consequences of molecular selection.
What the historical trial-success estimates actually show
A widely cited analysis by Wong, Siah, and Lo reported estimated oncology development success of 10.7% with biomarker stratification versus 1.6% without it in its historical dataset. These figures describe an observational association across development programs, not proof that adding a biomarker caused an individual trial to succeed or shortened enrollment by a fixed amount. Differences in program maturity, mechanism, trial design, disease type, and sponsor selection could contribute to the association. 9
FLAURA provides a more practical recruitment example
The FLAURA testing analysis reports 994 patients screened, 556 randomized, and 438 not randomized. Importantly, those 438 screening failures did not all arise from the same cause. The report identifies 224 negative tissue EGFR tests, 142 cases without an available result because of tissue or processing issues, 10 invalid results, and 62 patients with a positive EGFR result who did not meet other eligibility requirements. 2
This breakdown demonstrates the trade-off inherent in biomarker-driven trial design. A precise molecular definition can make the treatment effect interpretable, but it also means that recruitment depends on specimen quality, test availability, molecular prevalence, and nonmolecular eligibility criteria. Treating all screen failures as biomarker-negative would exaggerate the biological exclusion rate and conceal fixable operational barriers.
Practical efficiency review should therefore track at least four separate measures: biomarker prevalence, the fraction with interpretable assay results, the number failing other protocol criteria, and time from prescreening to randomization. These are proposed operational measures, not quantities measured by Noah for this case study.
Explore Clinical Evidence with Noah AI
Compare trial designs, biomarker-testing methods and published outcomes in a source-linked research workflow.
Get 300 Free Credits on Sign-Up · No Credit Card Required
Leveraging Data for Greater Insights and Faster Time to Market
The difficulty in biomarker-informed development is often not a lack of studies, but the need to reconcile different types of evidence. A mechanism paper may define a target; a companion diagnostic study defines the assay; a clinical protocol specifies who qualifies; and a randomized publication reports an endpoint. Without separating those layers, a review can accidentally attribute retrospective findings to prospective eligibility or transfer outcomes to an untested patient group.
A structured evidence table makes those boundaries visible. In the Noah report, each row links the biomarker to its testing method, patient population, actual comparator and clinical result. The limitations column states what the trial cannot prove. This makes the result suitable for an initial cross-functional review by clinical development, translational research and biomarker strategy teams—not for replacing primary-source verification or eligibility adjudication.
What a source-linked biomarker review should preserve
- Assay identity: test platform, specimen, assay version if known, and the positivity rule.
- Selection logic: whether the marker determined prospective enrollment, stratification, or only a later subgroup analysis.
- Clinical context: stage, line of therapy, histology, relevant molecular exclusions and comparator.
- Evidence quality: source publication, endpoint, follow-up period, denominators and negative or uncertain findings.
- Limits of inference: whether another mutation, specimen, cutoff, regimen or unselected population would require additional validation.
These distinctions are also necessary when interpreting treatment differences. The FLAURA, ALEX and KEYNOTE-024 hazard ratios should not be placed into a league table to declare one drug or biomarker superior. The studies enroll different biological subgroups and compare different interventions against different controls. Their shared lesson is about using validated trial-specific selection rules to produce interpretable evidence.
Similarly, a literature synthesis can identify where a biomarker test appears in an approved drug's evidence base, but it cannot demonstrate analytical validity, perform laboratory testing, establish clinical utility for a new indication, or replace regulatory and clinical assessment. A careful AI-assisted workflow helps surface these questions early; it does not resolve them automatically.
Conclusion: Biomarker Selection Is More Than a Molecular Label
The adoption of precision medicine has changed how oncology trials define their patients. FLAURA illustrates mutation-specific selection using tumor EGFR testing. ALEX demonstrates ALK-based enrollment linked to a particular immunohistochemistry assay. KEYNOTE-024 shows how an expression threshold can define a meaningful immunotherapy study population while remaining an imperfect predictor.
Biomarker selection can strengthen biological relevance and clarify treatment effects. It can also make screening, recruitment, assay access and generalizability more complicated. Historical program-success associations and individual trial outcomes should not be transformed into unsupported guarantees of faster development.
The practical value of Noah AI in this case is the ability to organize published evidence into reviewable, traceable comparisons: biomarker → testing method → patient eligibility → clinical endpoint → outcome → limitations. The final scientific and regulatory interpretation still belongs to qualified reviewers working with the original sources.
Build Your Next Biomarker Evidence Review
Use Noah AI to explore biomedical studies, connect clinical evidence to its source and prepare a structured research brief.
New users get 300 Free Credits · No Credit Card Required
Sign Up Free & Get 300 Credits →
Frequently Asked Questions
What is biomarker-based patient selection in a clinical trial?
It is the use of a specified biological measurement—such as a mutation, gene rearrangement or protein-expression level—to define who can participate in a study. The test and threshold should match the prespecified study question.
Can a blood-based EGFR test replace tissue testing?
Not automatically. The answer depends on the assay, clinical context, and its analytical and clinical validation. FLAURA used tissue-based eligibility; its plasma ctDNA analysis was retrospective. 2
Does PD-L1 TPS below 50% rule out all immunotherapy?
No. TPS ≥50% was the KEYNOTE-024 enrichment criterion for a specific pembrolizumab monotherapy trial, not a universal threshold for all immune-based regimens. Eligibility depends on treatment, indication and applicable clinical guidance.
Do biomarkers always make trials faster or more likely to succeed?
No. Enrichment may improve statistical efficiency, but biomarker rarity, test availability, specimen failure and enrollment logistics can offset those advantages. Historical observational success rates do not establish causation. 8 9