
Clinical Trial Registry vs Published Results: AI Guide (2026)
Linda
Learn how to compare ClinicalTrials.gov registry data with published results using AI. Explore SELECT (NCT03574597), trial endpoints, outcomes and evidence gaps.
A source-grounded walkthrough of the SELECT cardiovascular outcomes trial (NCT03574597): how to check registered protocols, published endpoints, statistical reporting, safety data, and the limits of automated interpretation.
Evidence cutoff: October 30, 2026 · Case study: SELECT / semaglutide · Research methods
Introducing Clinical Trial Registry-to-Publication Comparison
Clinical trials leave more than one public evidence trail. A registry record describes the intended design and outcomes, a posted-results module reports structured results, and a peer-reviewed paper explains the findings for a scientific audience. These sources overlap, but they do not always use the same wording, level of detail, or statistical display.
Comparing them is a practical way to ask whether the reported sample size matches the randomized population, whether a published outcome corresponds to a registered endpoint, and whether apparent differences are substantive or simply require more source verification. AI can help organize that comparison. It should not replace reading the registry, paper, statistical analysis plan, or amendments.
We illustrate the workflow with SELECT (NCT03574597), the cardiovascular-outcomes trial of once-weekly semaglutide 2.4 mg in adults with overweight or obesity, established cardiovascular disease, and no diabetes. The original results appeared in The New England Journal of Medicine in 2023 (PMID 37952131). Rather than treating an AI summary as the endpoint, this case connects each comparison to its underlying source.
17,604 randomized participants · 3-point MACE primary endpoint · 0.80 published hazard ratio
The figures above come from the original SELECT publication. They are not independently generated or predicted by Noah AI.
What Can Researchers Compare?
A registry-to-publication check is useful for endpoint benchmarking, trial due diligence, clinical evidence reviews, and understanding how a program's reporting evolved. For a single study, the central questions are concrete:
- Design and eligibility: Do the registry and paper describe the same population, randomized allocation, treatment, dose, and comparator?
- Enrollment: Is the figure planned enrollment, actual randomized enrollment, a full analysis set, or a safety population?
- Outcome definitions: Is the published endpoint the same composite and time-to-event measure named in the registration?
- Results: Are event counts, denominators, hazard ratios, confidence intervals, and follow-up dates reported consistently?
- Secondary claims: Did a statistical testing hierarchy permit confirmatory conclusions for every outcome being discussed?
- Safety and sources: Do adverse-event figures refer to treatment discontinuation, serious events, or a later analysis with another cutoff?
The aim is not to manufacture a single "consistency score." It is to separate genuine agreement, different reporting conventions, fields not directly comparable, and evidence that remains unverified.
The Noah Approach to Clinical Trial Evidence
In our Noah Agent research example, the question was framed in plain English: "Compare SELECT trial NCT03574597 on ClinicalTrials.gov with its original NEJM report. Verify trial design, patient eligibility, enrollment, primary and secondary endpoints, reported outcomes, safety findings, and the exact source of any differences."
Noah was asked to use the ClinicalTrials.gov study record and posted results, the 2023 SELECT primary publication, and the earlier rationale-and-design paper. A later 2025 safety publication was treated as a separate analysis of the same study, not another randomized trial.
The output was a structured evidence report, including two citation-oriented tables. The same method can be used for other named trials, provided that the source documents are accessible. This demonstration does not establish live, exhaustive ClinicalTrials.gov searching, automated amendment tracking, or validation of every trial's results.
Method note
The Noah report identified the registry snapshot it accessed and marked historical version-by-version changes as not verified because the full record history could not be inspected. That uncertainty is retained below, rather than silently filled in.
Compare Registry Data with Published Results: The SELECT Example
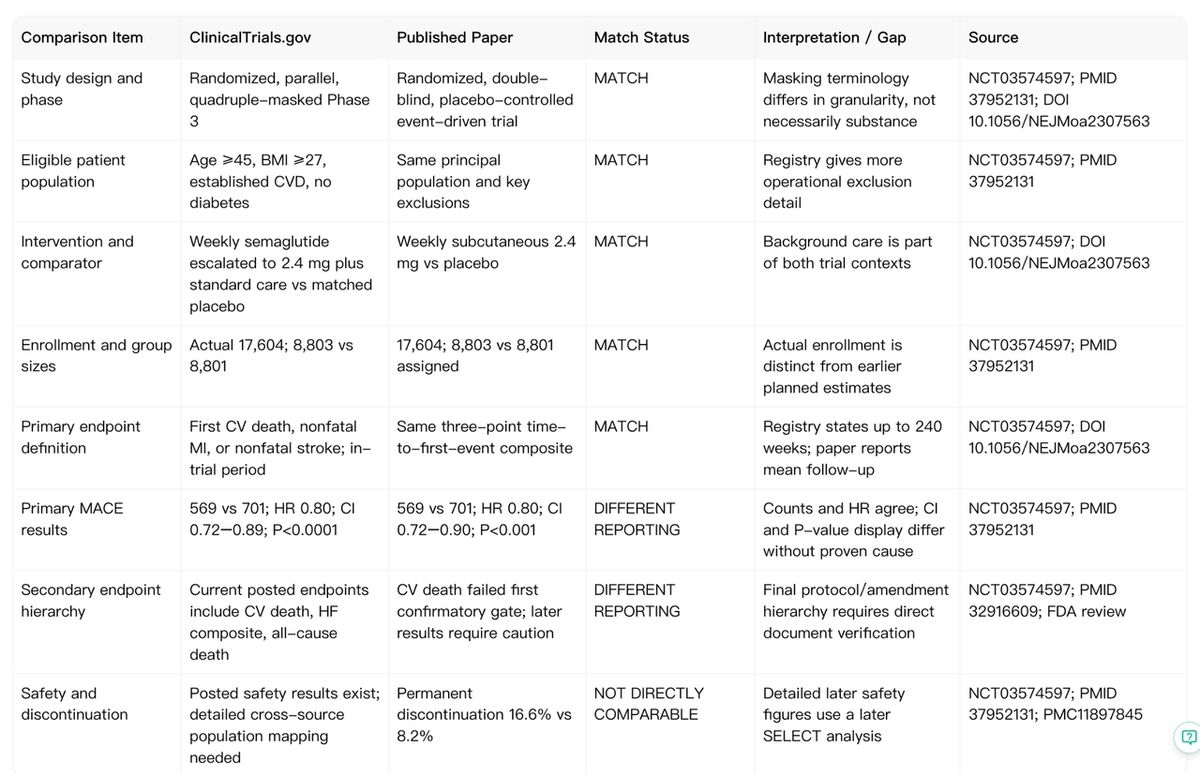
The first check confirmed that the major design features agree. The registry describes a randomized, parallel-group, Phase 3 study with quadruple masking across specified roles. The journal article calls it double-blind, placebo-controlled, and event-driven. Those labels differ in detail, but they are not necessarily contradictory descriptions of how masking worked.
Both sources also identify the same core population: adults at least 45 years old, BMI of 27 kg/m² or higher, established cardiovascular disease, and no diabetes. Participants were assigned to weekly subcutaneous semaglutide, escalated to 2.4 mg, or matched placebo alongside background care. Actual randomization totals match: 17,604 overall, including 8,803 assigned semaglutide and 8,801 assigned placebo.
A precise example: the primary MACE results
The prespecified primary endpoint was time to first cardiovascular death, nonfatal myocardial infarction, or nonfatal stroke—commonly called three-point major adverse cardiovascular events (MACE). The original paper reports 569 of 8,803 (6.5%) events in the semaglutide arm and 701 of 8,801 (8.0%) in the placebo arm, with HR 0.80 (95% CI 0.72–0.90; P<0.001). The observed difference in event proportions was 1.5 percentage points. This is distinct from a 20% relative reduction on the hazard-ratio scale.
The Noah report's inspected registry results display the same event counts and HR, but a confidence interval of 0.72–0.89 and P<0.0001. That is a difference in statistical reporting, not grounds for announcing a contradictory clinical result. Both P-value expressions are compatible with strong statistical evidence against the primary null hypothesis; their displayed precision differs. The reviewed sources did not establish a definitive reason for the small confidence-interval difference.
When a value differs, the appropriate next checks are the analysis model, censoring rules, data cutoffs, multiplicity or interim-analysis adjustments, and numerical presentation. These must be verified from original documents rather than guessed from a generated table.
Extract Clinical Endpoints and Assess Evidence
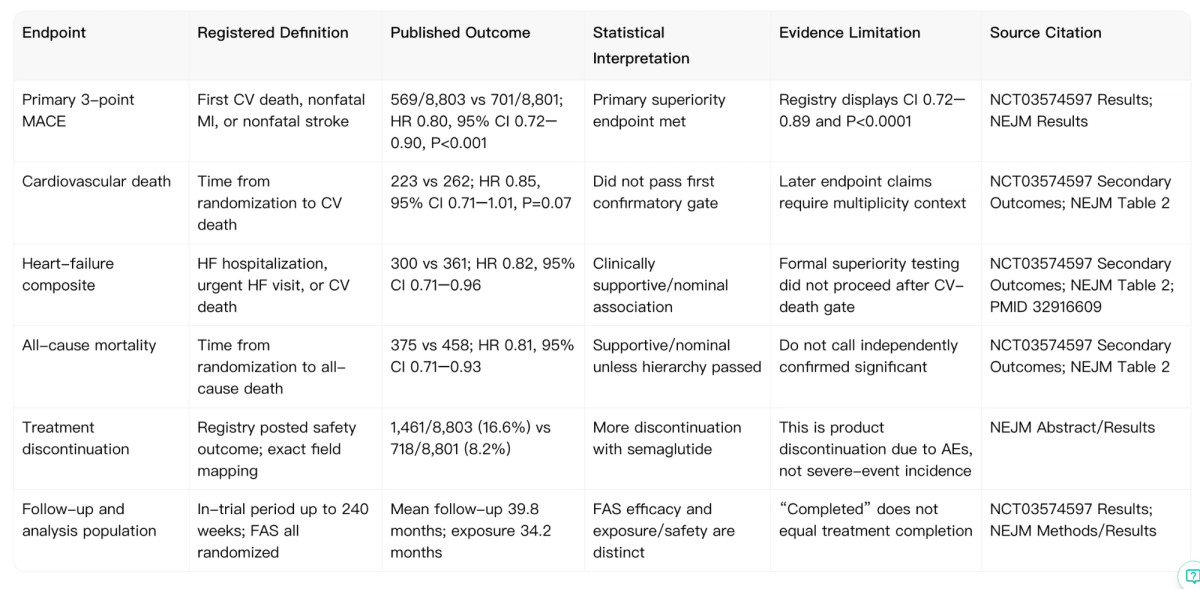
The second screenshot focuses on the distinction between a registered endpoint, an observed result, and the claim that result supports. This matters because outcomes listed in a registry do not all carry equal inferential status in the published statistical testing plan.
Primary success is not the same as secondary confirmation
The primary MACE endpoint met the trial's prespecified superiority criterion. However, cardiovascular death—the first confirmatory secondary endpoint—occurred in 223 versus 262 patients, HR 0.85 (95% CI 0.71–1.01; P=0.07). It did not pass the required gate in the hierarchical testing procedure. The NEJM article states that superiority testing was therefore not continued for later confirmatory secondary endpoints.
For the heart-failure composite, the reported HR was 0.82 (95% CI 0.71–0.96). For all-cause death, HR was 0.81 (95% CI 0.71–0.93). These estimates are useful, but their confidence intervals do not by themselves establish multiplicity-adjusted, independently confirmed treatment effects after the first gate failed. In a structured comparison, the statistical interpretation column is as important as the result column.
Use the correct safety denominator
Permanent discontinuation of trial product due to adverse events occurred in 16.6% versus 8.2%, respectively. This measures treatment discontinuation, not the rate of severe adverse events, and it is not synonymous with withdrawal from the entire study. The journal reported mean follow-up of 39.8 months and mean study-product exposure of 34.2 months; those are different measures.
A later analysis of SELECT safety outcomes reported additional adverse-event categories, but figures from that later publication should be labeled by their own population, date, and methodology. The Noah review appropriately left some detailed original-paper safety mappings unresolved rather than combining incompatible tables.
Verify Citations and the Original Sources
A useful AI comparison allows a researcher to move from a claim to a source. For SELECT, that means differentiating the current registry study description, the posted results module, the NEJM primary report, the older design paper, and later safety analyses.
The source report explicitly could not reconstruct every historical registry version or independently inspect the full text of a reported protocol amendment. It also could not confirm every original-paper supplemental safety statistic from accessible extracts. Those are real evidence gaps: a polished table cannot make them disappear.
In particular, a reported change in the heart-failure composite's classification should be checked against the actual dated amendment and prespecified analysis plan before drawing any conclusion. A protocol amendment is not, on its own, evidence of selective reporting or misconduct.
Supporting Better Evidence-Based Decisions
SELECT shows both the value and the limits of comparing trial sources. The registry and journal report agree on the population, randomized sample sizes, primary endpoint definition, event counts, and hazard-ratio point estimate. Some statistical values are displayed with different precision, while the secondary endpoint hierarchy and detailed safety populations require closer reading.
This kind of comparison helps medical affairs teams, clinical researchers, evidence reviewers, and R&D analysts assemble a traceable briefing without confusing protocol intent with observed outcomes. It can also reveal questions for a statistician or study team. It is not an automated audit of scientific integrity, a regulatory determination, or a substitute for examining original records.
The SELECT result applies to a selected population with preexisting cardiovascular disease, overweight or obesity, and without diabetes. It should not be generalized automatically to primary prevention, people with diabetes, or different treatment regimens.
Final Takeaway
The best registry-to-publication workflow does not try to collapse every source into one seamless narrative. It preserves what matches, describes reporting differences precisely, and highlights what remains unverified. Noah AI can help organize that evidence into tables with citations; qualified researchers remain responsible for validating source versions, analysis methods, and clinical interpretations.
TRY THE WORKFLOW — Explore Noah AI for Clinical Evidence Research
200 free signup credits. No credit card required.