
How to Compare Clinical Trials with AI: Step-by-Step (2026)
Linda
Learn how to compare clinical trials with AI using real Phase 3 studies. Analyze trial design, PICO, primary endpoints, efficacy, safety, and citations.
Evidence cutoff: October 27, 2026 · Case study: Five published randomized trials in moderate-to-severe atopic dermatitis
Comparing clinical trials is not as simple as placing treatment response rates in a spreadsheet. Two studies can investigate the same disease while enrolling different patients, using different comparators, choosing different primary endpoints, and measuring safety over different periods. If those differences disappear during extraction, the resulting comparison can be misleading even when every reported percentage is correct.
This guide shows a practical way to compare clinical trials with AI using a real Noah AI research workflow. We examined five published randomized phase 3 or phase 3b studies in moderate-to-severe atopic dermatitis: SOLO 1, ECZTRA 1, ADvocate 1, Measure Up 1, and Heads Up. The process covers trial identification, PICO extraction, endpoints, outcomes, safety, citation checking, and the limits of cross-trial comparisons.
The screenshots below come from an actual Noah AI research output. The example is a published-evidence comparison, not a demonstration of a comprehensive or real-time ClinicalTrials.gov registry search, automated eligibility screening of every registered trial, or live competitive monitoring.
Quick answer: What should a clinical trial comparison include?
A useful trial comparison should keep the following information together:
- Phase and design: randomization, blinding, intervention arms, and comparator type.
- Population: diagnosis, severity, age eligibility, prior treatment, sample size, and analysis denominator.
- Intervention and comparator: actual molecule, dose, schedule, route, and background treatment.
- Primary endpoint: the prespecified outcome definition, assessment timepoint, and analysis rules.
- Efficacy and safety: both arms' reported findings, adverse events, severity, and observation period.
- Source provenance: trial identifier (NCT), publication (PMID/DOI), version or correction, and unresolved gaps.
AI can help extract and organize these fields. It cannot make incompatible study designs interchangeable or infer missing values from an abstract.
Step 1. Define a specific disease and comparison question
Begin with a clear research question instead of a broad request such as "find the best eczema drug." A useful example is:
Across published phase 3 or phase 3b randomized trials in moderate-to-severe atopic dermatitis, how do enrolled populations, interventions, comparators, primary endpoints, week-16 outcomes, and reported safety findings differ?
Atopic dermatitis is a useful case because it includes biologics and a small-molecule JAK inhibitor studied under different randomized designs. The five prespecified trials represent IL-4Rα inhibition (dupilumab), IL-13 inhibition (tralokinumab and lebrikizumab), and JAK1 inhibition (upadacitinib). Those pharmacological differences provide context, but the clinical comparison must still begin with the trial design.
Establish eligibility rules before extracting results: randomized interventional study, published phase 3 or 3b primary report, moderate-to-severe atopic dermatitis, identifiable NCT record, a prespecified primary endpoint, and at least some accessible safety information. Decide in advance to keep companion studies distinct: SOLO 1 is not SOLO 2, ECZTRA 1 is not ECZTRA 2, ADvocate 1 is not ADvocate 2, and Measure Up 1 is not Measure Up 2.
Step 2. Identify the five eligible trials and their sources
For this demonstration, the evidence set contains the following published trials:
| Trial | Drug and comparator | Phase | Primary publication |
|---|---|---|---|
| SOLO 1 | Dupilumab versus placebo | 3 | [Simpson et al., 2016 — PMID 27690741](https://pubmed.ncbi.nlm.nih.gov/27690741/) |
| ECZTRA 1 | Tralokinumab versus placebo | 3 | [Wollenberg et al., 2021 — PMID 33000465](https://pubmed.ncbi.nlm.nih.gov/33000465/) |
| ADvocate 1 | Lebrikizumab versus placebo | 3 | [Silverberg et al., 2023 — PMID 36920778](https://pubmed.ncbi.nlm.nih.gov/36920778/) |
| Measure Up 1 | Upadacitinib 15 mg or 30 mg versus placebo | 3 | [Guttman-Yassky et al., 2021 — PMID 34023008](https://pubmed.ncbi.nlm.nih.gov/34023008/) |
| Heads Up | Upadacitinib 30 mg versus dupilumab | 3b | [Blauvelt et al., 2021, corrected — PMID 34347860](https://pubmed.ncbi.nlm.nih.gov/34347860/) |
Each trial should also be linked to its public registration: NCT02277743, NCT03131648, NCT04146363, NCT03569293, and NCT03738397, respectively.
Registration and publication serve different purposes. A registry entry establishes the protocol context and may contain results or status updates; a published paper provides its specific analysis and reporting. Verify the publication's cutoff and the registry's last-update date rather than assuming they describe the same timepoint. This guide does not assert current enrollment status for every study.
Step 3. Extract population, intervention, comparator and trial design (PICO)
A PICO matrix makes hidden design differences visible. For every trial, record the exact population and severity thresholds, dose and administration route, placebo versus active comparator, treatment duration, and any permitted rescue therapy.
For example, SOLO 1 included 671 adults with inadequately controlled moderate-to-severe atopic dermatitis and evaluated two dupilumab schedules against placebo at 16 weeks. ECZTRA 1 enrolled 802 adults with specified disease-severity thresholds and tested tralokinumab versus placebo, followed by a responder-selected maintenance period. ADvocate 1 included adolescents and adults and used a lebrikizumab induction and maintenance framework. Measure Up 1 randomized 847 adolescents and adults into distinct upadacitinib 15 mg, 30 mg, and placebo groups. Heads Up compared two active treatments, upadacitinib 30 mg and dupilumab, in adults. These are different populations and different treatment questions.
Noah AI example: Trial design and primary endpoint matrix
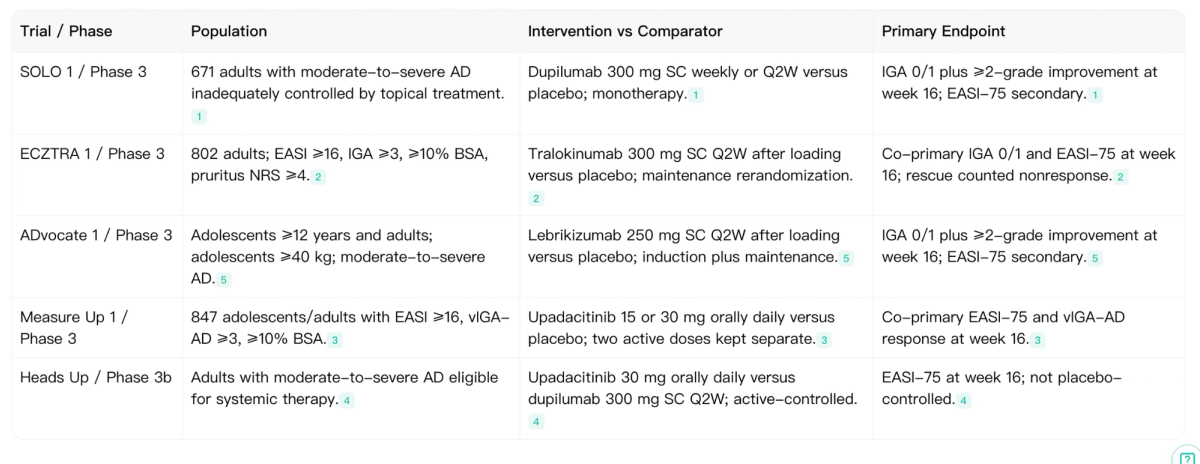
The design matrix prevents two common extraction errors: counting a companion trial twice and presenting an active-control study as if it were a placebo comparison. It also shows why the two upadacitinib doses in Measure Up 1 must remain separate.
Step 4. Preserve the exact primary endpoint and timepoint
Clinical endpoints often look similar but are not interchangeable. The Investigator's Global Assessment (IGA) is an ordinal assessment of disease severity; an IGA 0/1 response typically requires clear or almost-clear skin plus a specified improvement from baseline. The Eczema Area and Severity Index 75 (EASI-75) means a reduction of at least 75% in EASI from baseline. vIGA-AD is a validated IGA variant with its own protocol definition.
In SOLO 1, the primary outcome was IGA 0/1 with at least a two-point improvement at week 16; EASI-75 was secondary. ECZTRA 1 had co-primary IGA 0/1 and EASI-75 endpoints at week 16. ADvocate 1 used IGA response as its primary endpoint, while Measure Up 1 had co-primary EASI-75 and vIGA-AD responses. Heads Up used EASI-75 at week 16, but crucially as a direct active-treatment superiority comparison.
Before comparing numbers, record the timepoint and how rescue treatment, missing data and nonresponders were handled. A 16-week induction rate should not be silently compared with 52-week maintenance among only those who initially responded.
Step 5. Extract efficacy outcomes without creating an indirect ranking
A good extraction uses the same hierarchy for each study: the primary endpoint first, then important secondary outcomes, then effect estimates, and finally limits of interpretation. Include both the intervention and comparator groups, rather than reporting a treatment response percentage alone.
The published week-16 findings illustrate why comparator context is essential:
| Trial | Published outcome within its own randomized comparison |
|---|---|
| SOLO 1 | IGA response: dupilumab every other week 38%, weekly 37%, versus placebo 10%. |
| ECZTRA 1 | IGA 15.8% vs 7.1% and EASI-75 25.0% vs 12.7% for tralokinumab versus placebo. |
| ADvocate 1 | IGA 43.1% vs 12.7% and EASI-75 58.8% vs 16.2% for lebrikizumab versus placebo. |
| Measure Up 1 | EASI-75 70% / 80% vs 16% and vIGA-AD 48% / 62% vs 8% for upadacitinib 15 mg / 30 mg versus placebo. |
| Heads Up | EASI-75 72.4% vs 62.6% for upadacitinib 30 mg versus dupilumab, in the corrected article (n=342 vs n=331). |
These are within-study findings, not a ranking of the five drugs. They vary in population, placebo response, endpoint, dose, rescue rules, blinding, background care, and sometimes treatment class. Heads Up is the single direct active-comparator test in this set; it supports a specific conclusion for its randomized population rather than a universal ranking.
Important source-version check for Heads Up. An earlier version of the article reported different denominators. The current JAMA Dermatology article states that a February 14, 2024 correction removed 19 participants from one center. Use the revised 673-patient analysis (342 upadacitinib; 331 dupilumab), with week-16 EASI-75 of 72.4% versus 62.6%, instead of mixing values from the pre-correction publication. The discrepancy flagged in the Noah research output was resolved by examining the corrected publisher record.
Compare Published Clinical Evidence with Noah AI
Turn a focused research question into a structured, source-linked trial review. Sign up for 300 Free Credits — No Credit Card Required.
Step 6. Compare safety using the appropriate denominator and observation window
Efficacy and safety need separate extraction columns. For safety, distinguish any adverse event, serious adverse event, adverse event leading to discontinuation, and specific event categories. Record whether the value comes from a 16-week induction, a 24-week active comparison, or a longer responder-enriched follow-up.
In SOLO 1, conjunctivitis and injection-site reactions were reported more often with dupilumab than placebo. ECZTRA 1 reported adverse events in 76.4% of tralokinumab-treated versus 77.0% of placebo-treated patients during its initial 16 weeks; that single all-event rate is not a substitute for serious-event breakdowns. ADvocate 1 reported more conjunctivitis with lebrikizumab, with most reported induction adverse events mild or moderate. In Measure Up 1, acne occurred in 7% with upadacitinib 15 mg, 17% with 30 mg, and 2% with placebo at 16 weeks.
Heads Up reported different safety patterns across two active drugs. Serious infections, eczema herpeticum, herpes zoster and laboratory-related adverse events occurred more often with upadacitinib, while conjunctivitis and injection-site reactions occurred more often with dupilumab in that study. These are observed trial comparisons, not proof that all instances of a reported event were caused by the drug.
Noah AI example: Outcomes and safety evidence
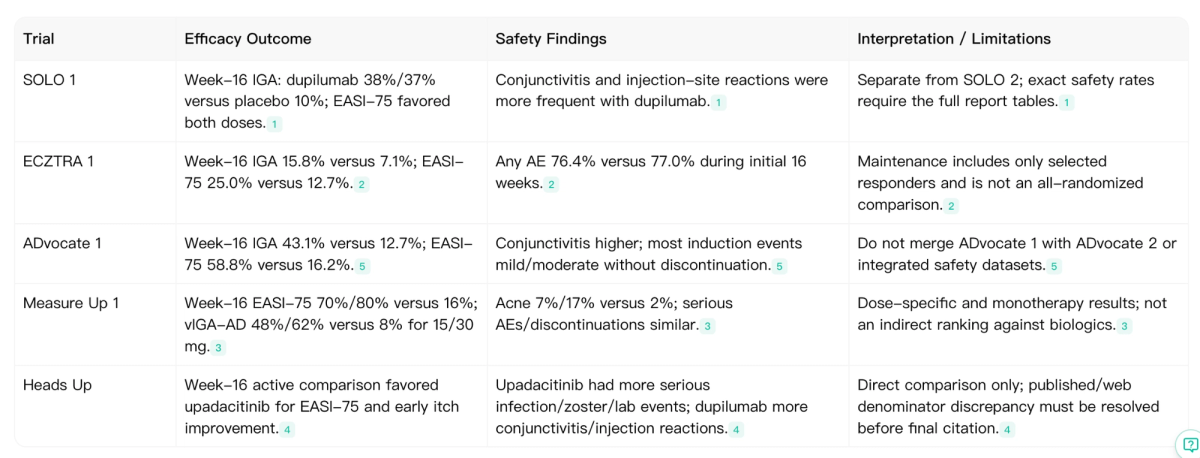
The report also identifies fields that still require review of full supplementary tables. If a paper's accessible abstract does not provide a serious-event numerator, the correct entry is "not verified from available source", not a guessed percentage.
Step 7. Verify citations and document what cannot be concluded
For every extracted claim, map the value back to a publication, registry record, and—where relevant—the corrected article version. Record the PMID, DOI, NCT identifier, denominator, analysis timepoint, and location of the supporting outcome table. This is particularly important when a single article presents results from two companion trials.
A final comparison should explicitly separate three levels of inference:
- Direct within-trial comparisons: supported when the arms were randomized within the same study and the prespecified endpoint and timepoint are clear.
- Descriptive cross-trial comparisons: useful for mapping differences in design and findings, but not a causal comparison of treatments.
- Unsupported inferences: naming a universal "most effective" or "safest" drug from unrelated percentages, pooling unmatched adverse-event rates, or claiming a network meta-analysis without appropriate methods.
AI-assisted extraction is useful precisely because it can make this structure easier to review—but only if uncertainty and missing fields remain visible. A source-linked table is an organizing tool, not an automatic quality or risk-of-bias assessment.
A practical AI prompt for comparing published clinical trials
You can use a concise prompt like the following in a biomedical research assistant:
Identify SOLO 1, ECZTRA 1, ADvocate 1, Measure Up 1, and Heads Up in moderate-to-severe atopic dermatitis. Use their original published results and verified NCT records. Extract Phase, Population, Intervention, Comparator, Primary Endpoint, timepoint, efficacy results, safety findings, denominators, PMID/DOI/NCT, and limitations. Keep companion trials and drug doses separate. Flag article corrections and missing safety values. Do not rank treatments indirectly or claim comprehensive real-time trial-registry coverage. Output a trial-design matrix and an outcomes-and-safety matrix with source citations.
In this case study, we ran a more detailed version of that workflow in Noah AI and reviewed the resulting structured evidence tables. What is shown is an example of organizing accessible published research, not evidence that every registry entry or full-text supplement was exhaustively retrieved.
Frequently asked questions
Can AI compare phase 3 clinical trials?
Yes—AI research tools can help extract trial-design fields and published findings into a structured table. The validity of any treatment comparison still depends on the study designs, population overlap, endpoint definitions, quality of the sources, and manual verification of consequential claims.
What is the difference between PICO and a clinical trial results table?
PICO describes the Population, Intervention, Comparator and Outcomes that define the study question. A results table adds observed effect estimates, denominators, follow-up, statistical uncertainty and adverse events. Both are needed for a defensible comparison.
Why not compare EASI-75 percentages across all five trials to find the best treatment?
The studies were not all randomized against the same comparator or conducted in interchangeable populations. EASI-75 is also not the primary endpoint of every included trial. A direct comparison such as Heads Up answers a narrower and more reliable question than an informal cross-trial ranking.
Are ClinicalTrials.gov records the same as published trial results?
No. Registry records can describe protocols, recruitment and submitted results, while a journal paper reports a defined analysis of a study at a specific time. Results availability, updates and publication versions may differ. Verify both sources when possible.
Can AI automatically verify safety rates?
An AI system may locate and organize reported safety findings, but it may lack access to complete appendices or the appropriate analysis denominator. Treat unsupported event rates as missing, and verify serious or clinically important findings in the full publication and supplemental material.
Conclusion
Comparing clinical trials effectively means preserving the conditions under which each result was generated. Across SOLO 1, ECZTRA 1, ADvocate 1, Measure Up 1 and Heads Up, the key lessons are consistent: keep each trial separate, extract exact PICO fields, retain dose and comparator, respect the primary endpoint, compare safety over like-defined windows, and confirm every citation against the current source version.
Noah AI can help researchers organize these published studies into readable, traceable evidence tables. It does not eliminate the need to inspect original trial documents or justify any indirect comparison.
Try Your Next Clinical Trial Comparison with Noah AI
Review published clinical evidence, structure PICO and endpoint information, and build cited trial-comparison tables from a research question.
Get 200 Free Credits on Sign-Up — No Credit Card Required.